{{office.HeaderText}}

{{office.Address}}

{{office.TeleponeNumber}}

{{office.MobileNumber}}

{{office.Email}}

< Back to Data Analytics
Click to Activate

Nationalities of OPTO test takers


Above is a map showing the relative percentage of all nationalities that have completed OPTO. Click on the map above to further inspect.

Fun Fact: People from 132 unique nationalities, representing all world continents, have completed OPTO.


On the right, you can see the 10 most frequent nationalities that have completed OPTO. Click on the widget on the right to further inspect.

Fun Fact: Our test takers are most frequently from countries within Scandinavia.

Flowers

What is the test taker gender ratio?


The female to male ratio amongst OPTO test takers show that there are more males than females that have completed OPTO.

white photo or space

What is the age of our test takers?


The extracted data depicts an age interval ranging from 18 to 69 years.

Hint: Click on the widget to inspect it further.

Fun Fact: The most frequent age for OPTO test takers is 27 years.

Fun Fact: The average age for an OPTO test taker is 37.5 years.


white photo or space

Flowers

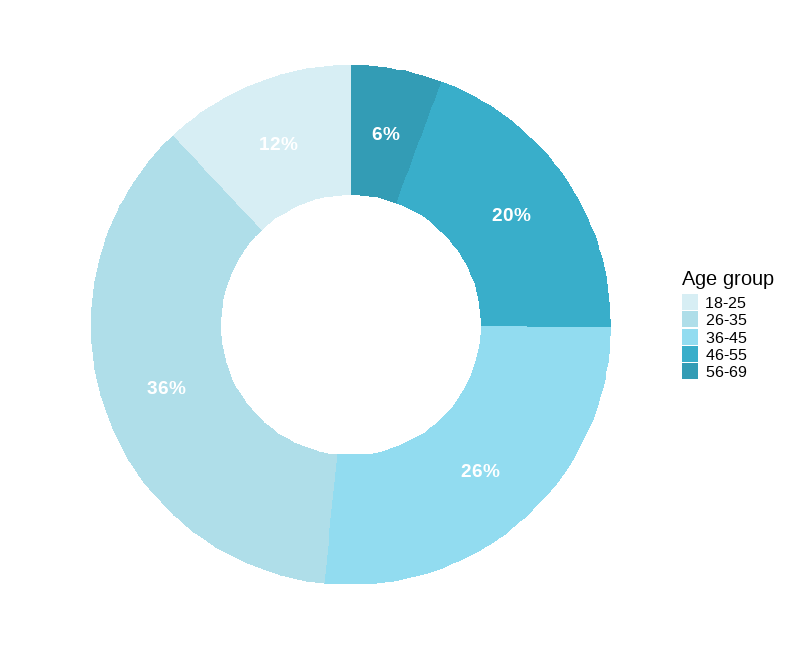
Which age groups are represented?


The plot on the left depicts the relative percentage of each aggregated age group.

Fun Fact: Nearly half (48%) of the OPTO test takers in the extracted data are under 36 years old.


white photo or space

What about education level?


The widget on the right depicts the relative percentage of test takers within each educational level. Click on the widget to further inspect.

Fun Fact: It is more common for OPTO test takers to have completed a PhD than primary school alone.

white photo or space

white photo or space


What are their employment status and role?


The widget to the left shows how many percent are within each employment category. Explore it further by hovering over the widget.

Fun Fact: There are more students among OPTO test takers than top managers.